

Offices don’t struggle with a lack of data—they struggle with fragmented data, inconsistent definitions, and delayed visibility. A custom dashboard solves that by turning your operational numbers into a clear, shared view that teams can understand at a glance and act on immediately.
Grafdom designs and develops custom KPI dashboards built for real office environments: meeting rooms, operations floors, customer service areas, and executive spaces. The goal is simple—put the right metrics in front of the right people, in the right format, so performance becomes visible and decision-making becomes faster.

Grafdom delivers end-to-end dashboard services
Real-Time Visibility for High-Performing Teams
Grafdom’s custom KPI dashboards provide real-time business performance visibility by integrating live data from multiple systems into one clear, easy-to-read view. Designed for office environments, our dashboards help teams make faster decisions, improve accountability, and achieve business goals efficiently.

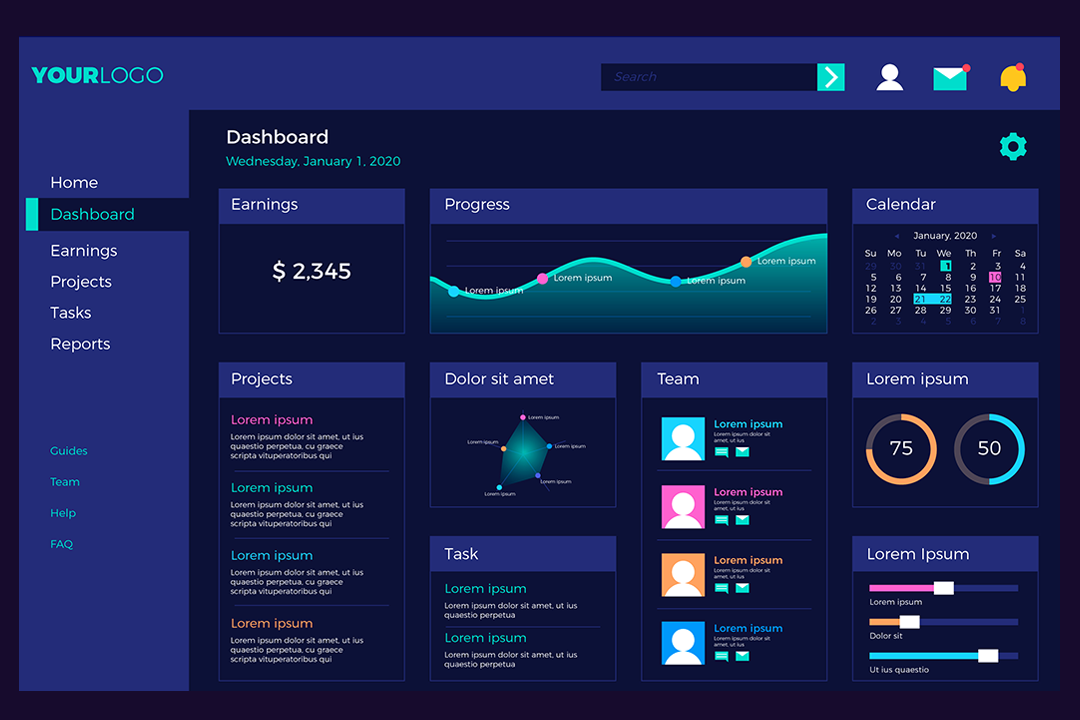
What a custom office dashboard should achieve
A dashboard is only useful when it changes what people do. In offices, a well-designed dashboard typically delivers three outcomes:
- Reduces time wasted searching for numbers across multiple systems.
- Makes performance and priorities visible to the whole team.
- Creates consistency — one source of truth, shared KPIs, and trusted data.
Grafdom Custom Dashboard Services
Grafdom’s dashboard delivery service covers everything from KPI planning to deployment and long-term support. This is not just design — it’s a structured approach to building reliable, readable, operational dashboards.


KPI Discovery and Dashboard Strategy
We begin by defining what the dashboard is for, who will use it, where it will be displayed, what decisions it must support, and which KPIs influence outcomes.
Dashboard UI/UX Designed for Office Visibility
Office dashboards must be readable at a distance and comprehensible in seconds. We design dashboards with clear hierarchy, restrained visual noise, and “at-a-glance” components so teams can absorb what matters without effort.


Data Integration and KPI Governance
Most businesses don’t run on one platform. We build dashboards that consolidate the KPIs you care about across your systems, then document KPI definitions and calculation rules so teams trust the numbers and stop debating the source of truth.
Office TV dashboards and KPI wallboards
If the purpose is to keep teams aligned throughout the day, we can design dedicated wallboard views for TVs and large screens. These views prioritise visibility, stability, and clarity—so the dashboard performs in real office conditions, not just on a laptop.


Reporting, Distribution, and Stakeholder Visibility
Not every stakeholder wants to log in and explore charts. We can structure dashboards and reporting outputs so leadership, team leads, and operations teams all get the level of visibility they need—without adding manual reporting work to your week.
Ongoing Maintenance and Optimisation
Dashboards evolve: KPIs change, systems change, and leadership priorities shift. Grafdom can support dashboards as a long-term asset—making sure they stay accurate, secure, and aligned with how your business runs.


Common Office Dashboard Use Cases
- Executive dashboards: A high-level view designed for leadership and management reviews—focused on the KPIs that indicate business health, momentum, and risk.
- Operations dashboards: Capacity tracking, throughput, cycle times, workflow performance, and service metrics.
- Sales performance dashboards: A visibility layer for targets, pipeline movement, and team activity, built to keep efforts aligned to outcomes.
- Customer service dashboards: A real-time view of queues, response performance, and service quality, designed to help managers balance workloads and spot issues early.
Why Grafdom
Grafdom doesn’t just deliver dashboards—we deliver clarity, actionable insights, and measurable impact. We combine design, technology, and business understanding to create dashboards that teams actually use, trust, and rely on every day.
- Impact-Driven: Dashboards designed to drive faster, better decisions.
- All-in-One Delivery: KPI strategy, design, integration, and support handled in-house.
- Office-Ready: Readable, intuitive dashboards for rooms, floors, or wallboards.
- Trusted Data: One source of truth with clear KPI definitions.
- Real-Time Visibility: Live insights from multiple systems in a single view.
- Future-Proof: Ongoing optimization keeps dashboards accurate and relevant.
Grafdom builds dashboards people trust and rely on, turning data into decisions and metrics into real results.
[request_services_form]